A refreshingly simple take on data analysis with Metabase
With so many data analysis platforms out there all with different cost, deployment models and complexity it can be hard to decide what to run with. I was looking for a tool to generate some reports on benchmark data and quickly fell in love with this platform.
If you need a very intuitive, fast and feature rich analysis platform I urge you to take a look at Metabase. Not only is it free (it does support some paid enterprise features too) but it can be deployed and ready for you to give it a go in a matter of seconds if you have a docker host or even docker desktop running.
I have created a Git repository with everything you need to get a basic PostgresSQL backed Metabase environment running. Let's run through the configuration and run a sample report.
Setup
From a command line where you want this project located clone the repository using:
git clone https://github.com/virtual-bridge/postgres-metabase.git
Now jump into the directory:
cd postgres-metabase/
Create the .env variable file where you will be storing the desired database name/passwords
cp sample.env-file .env
Open up the .env file using an editor of your choice, I like nano.
nano .env
Edit those placeholder values and save the file. The user encryption key needs to be at least 16 characters long.
Now you can run this up using Docker Compose and as a daemon background task (the -d bit)
docker-compose up -d
Give it a few minutes, this will create the database server, associated users and databases required for metabase. You can then hit http://yourhost:3001 (this port can be changed in the docker-compose.yml file)
Using Metabase
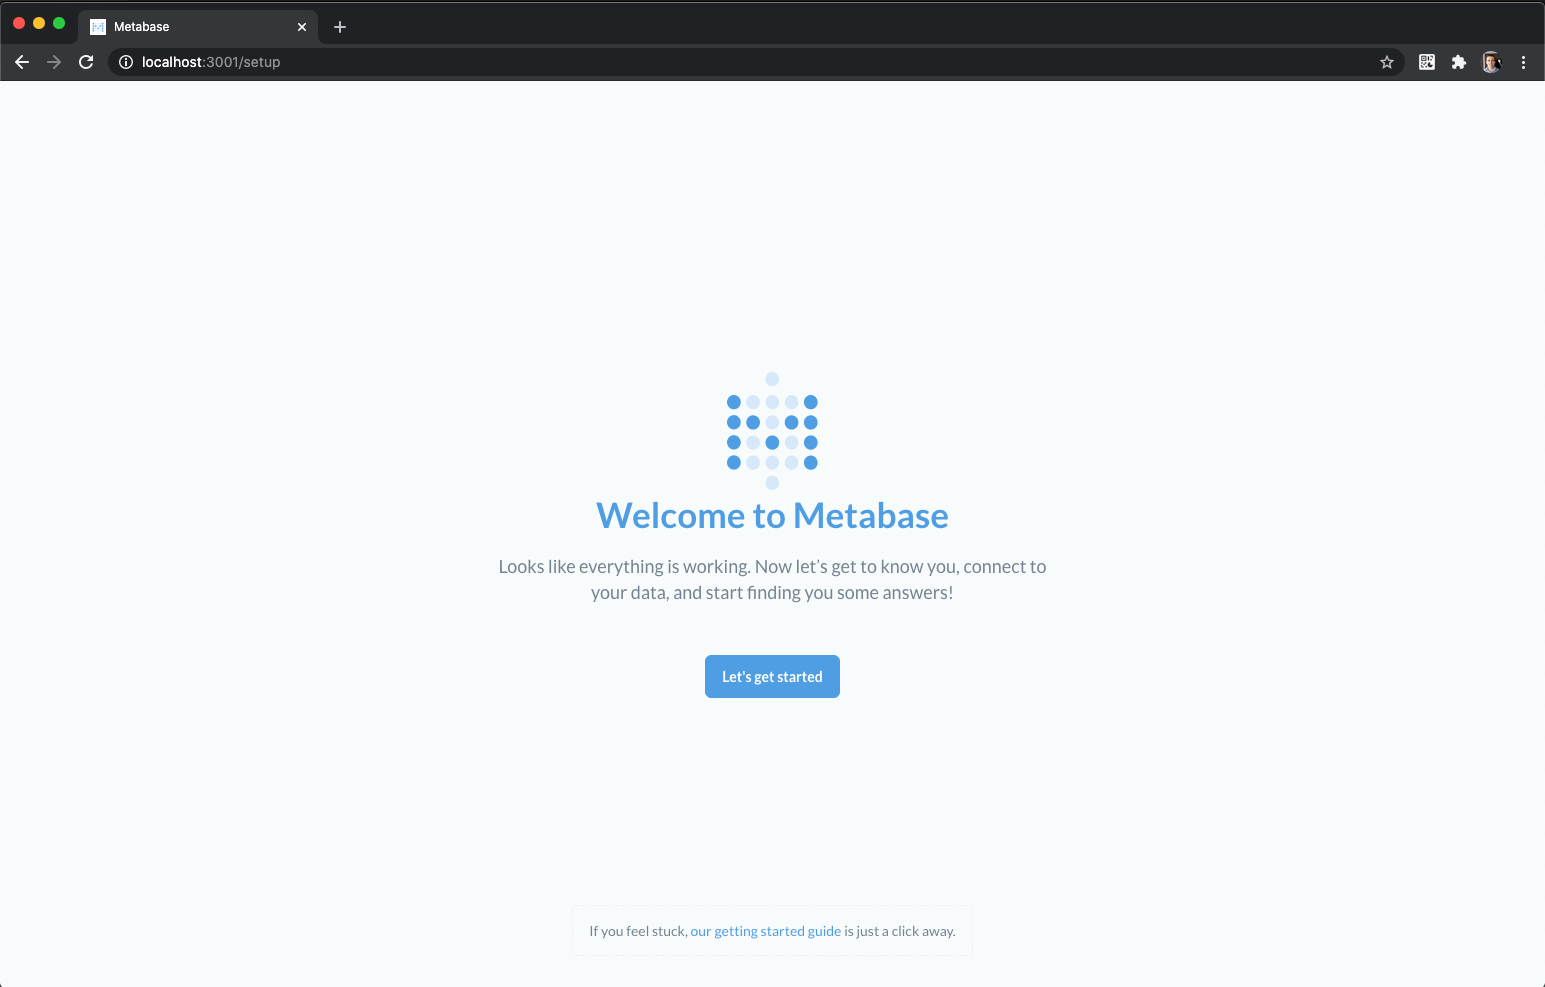
Once you get to it online and have the splash screen in your browser run through the wizard.
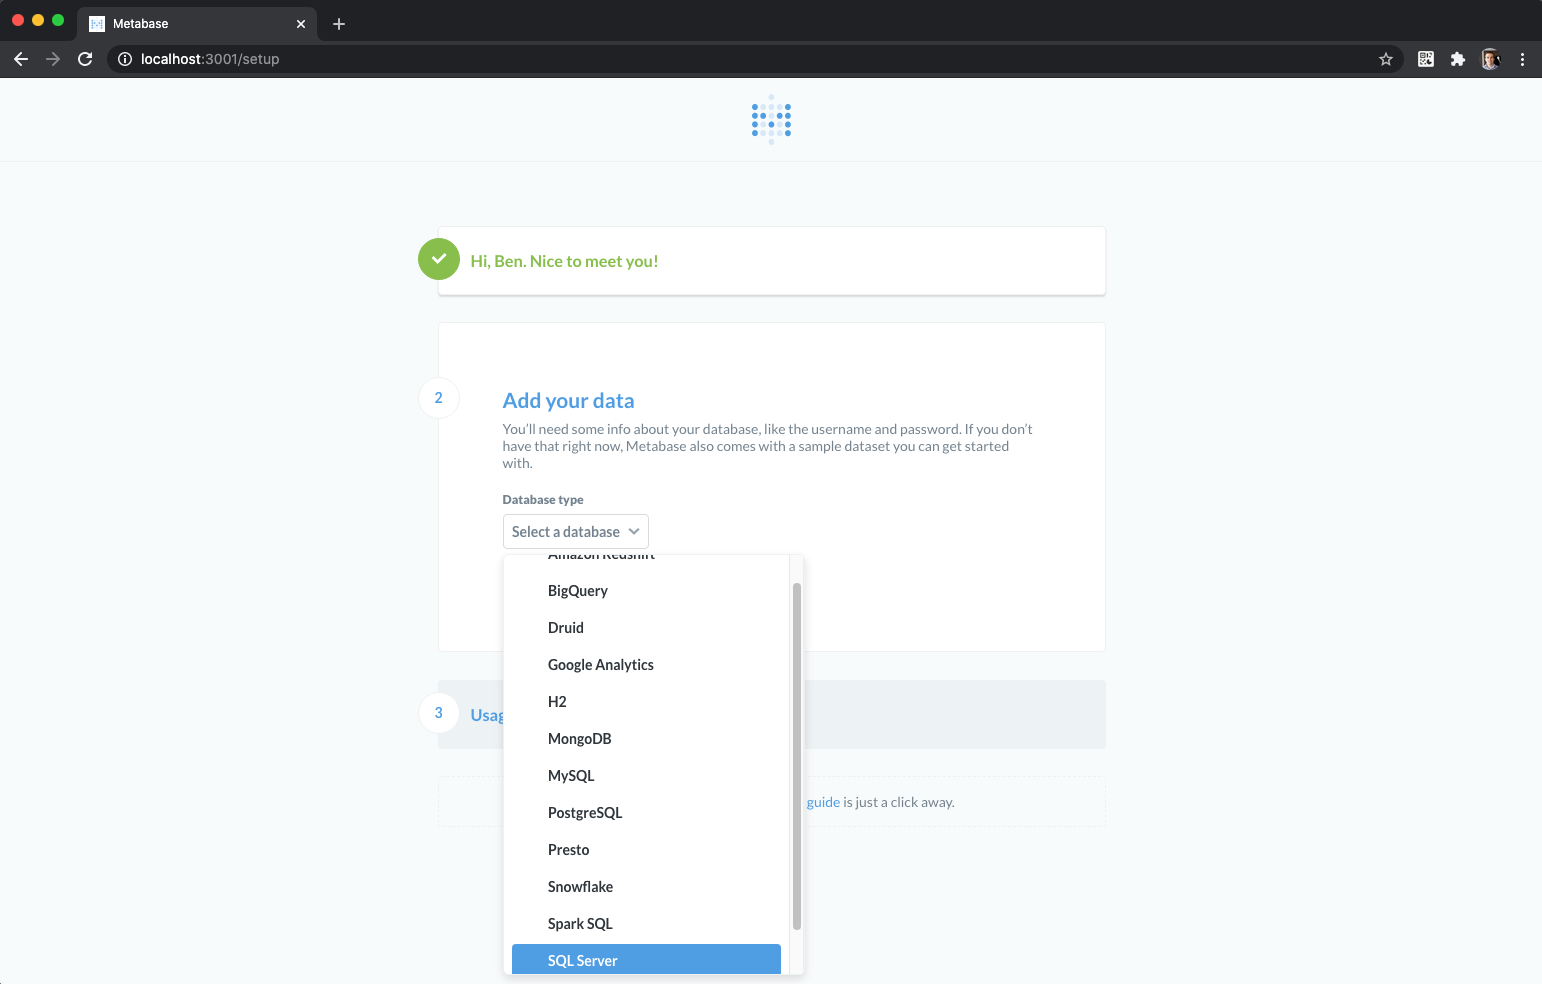
Enter in your admin details and now you can add a data source, lots of supported ones in there! You can skip this if you like and add later.
I will add a test database with only a few bits of data so we can run through how to create "questions" and present that data.
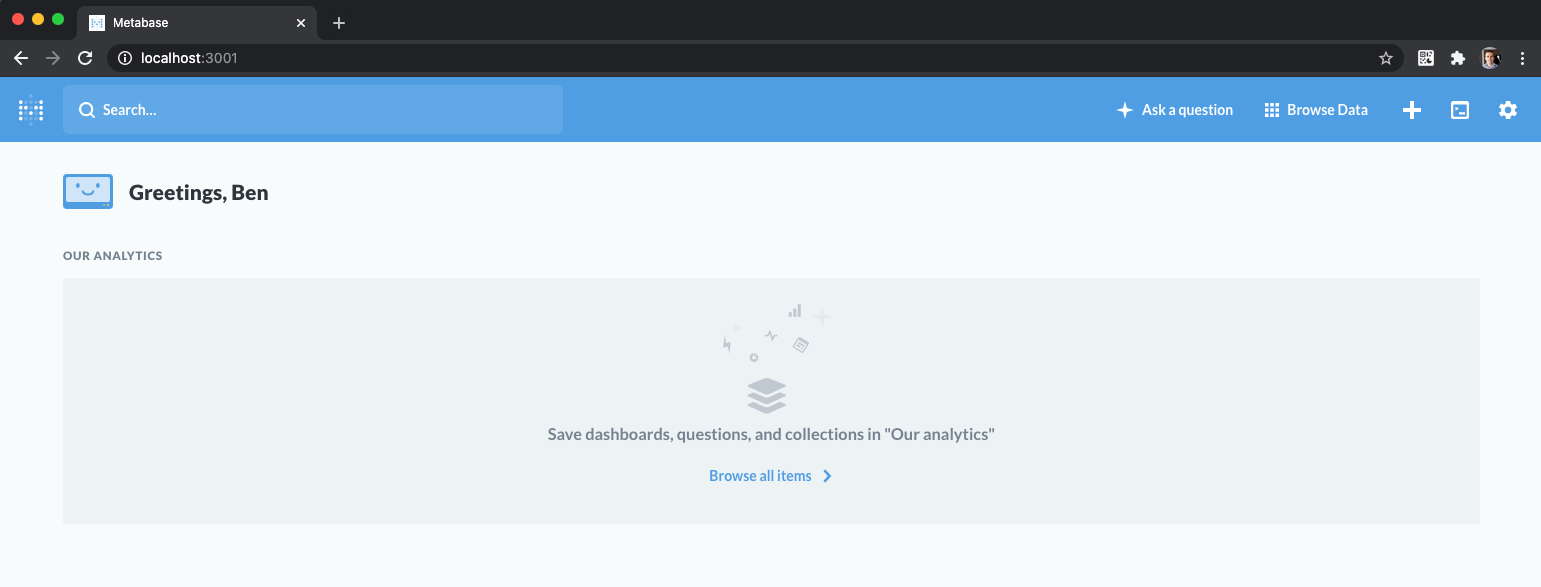
Everything will look a little blank... let's get analysing.
Hit the Ask a question button and you will get some options.
- Simple = Start clicking around the tables, easy GUI editor
- Custom = Slightly more advanced editor but still a nice GUI
- Native = Write your own SQL
We will use Simple for this example but you will soon want to jump into custom to unleash the power, or even the native query.
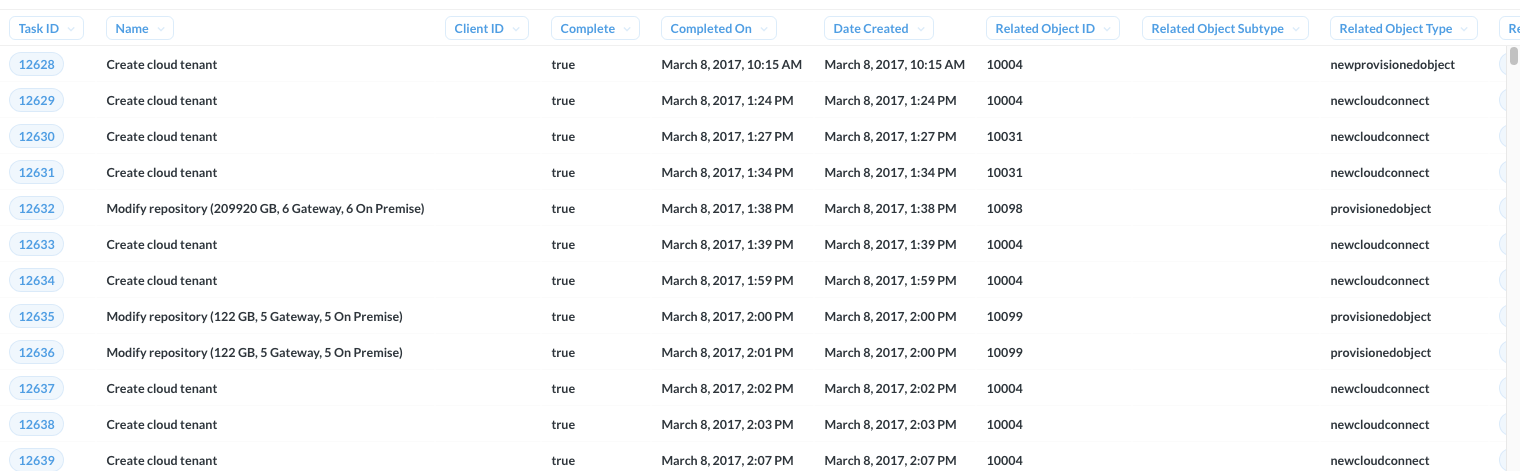
I have selected a task log table. By default when you select simple it will just list the data in a table.
Now you have some data you have options to do things like grouping, visualisation, couple of examples.
Sample 1
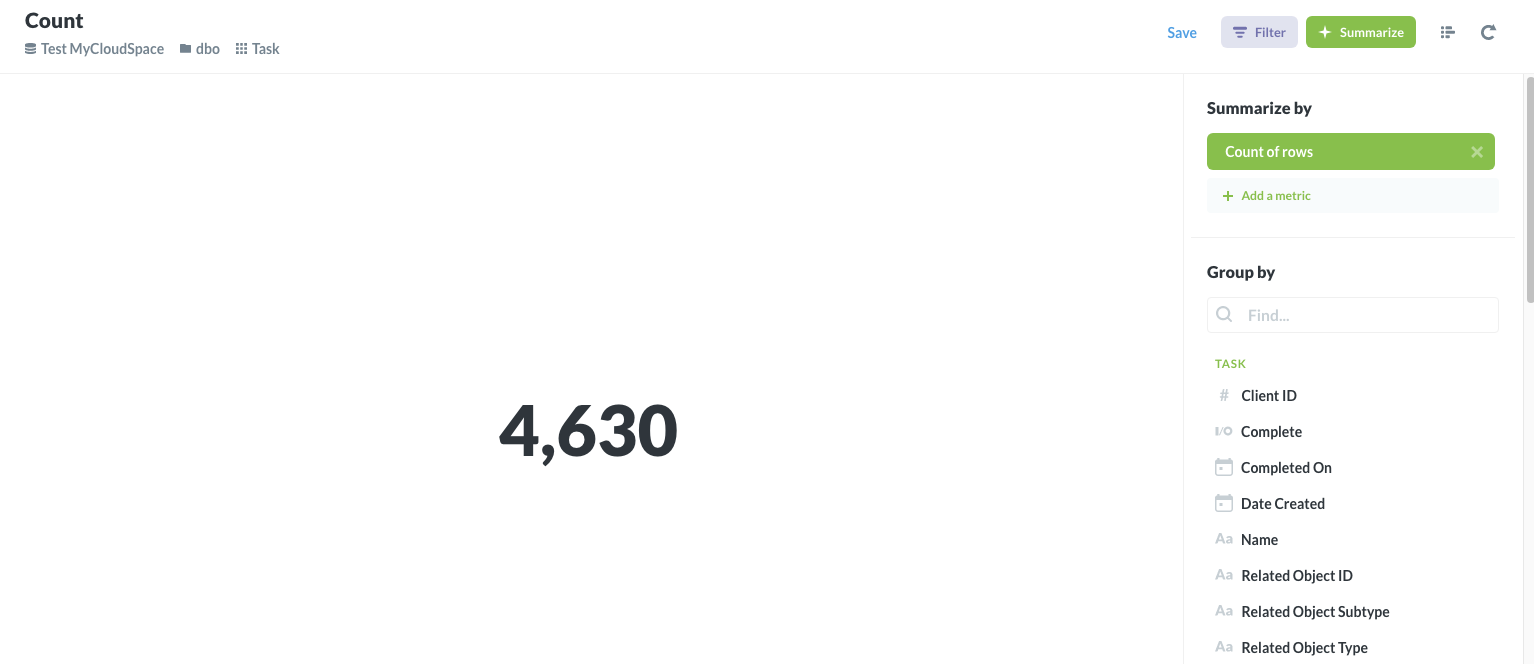
Lets do a simple "count" and show a gauge of the total number of tasks in this table
Click the Summarise button, count of Rows should be selected, you can then click done. This will turn the grid data into a number like the following:
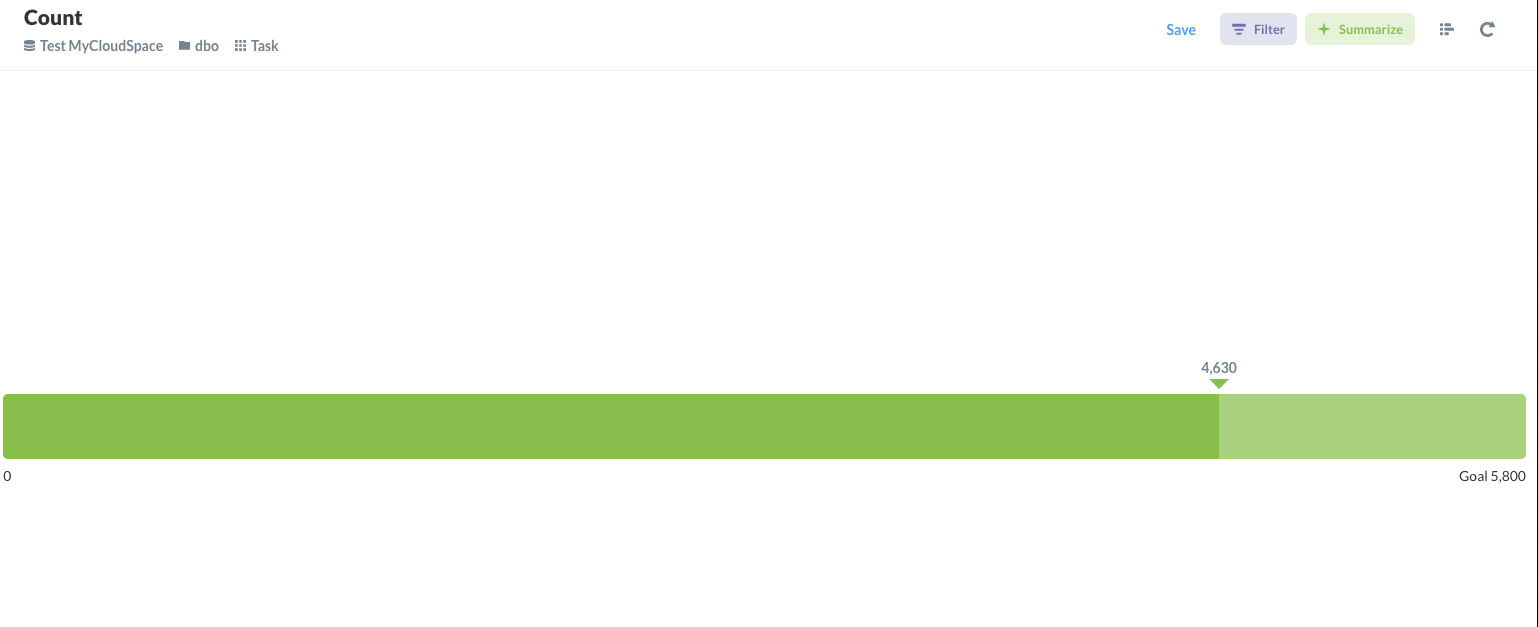
That is neat and might be all you need but you can change the visualisation options using the visualisation button bottom left. I will change this to a "goal" of 5800, you will see it then quickly changes the view to be the following
You can play around with the settings or try the other count based visualisations, onto the next example.
Sample 2
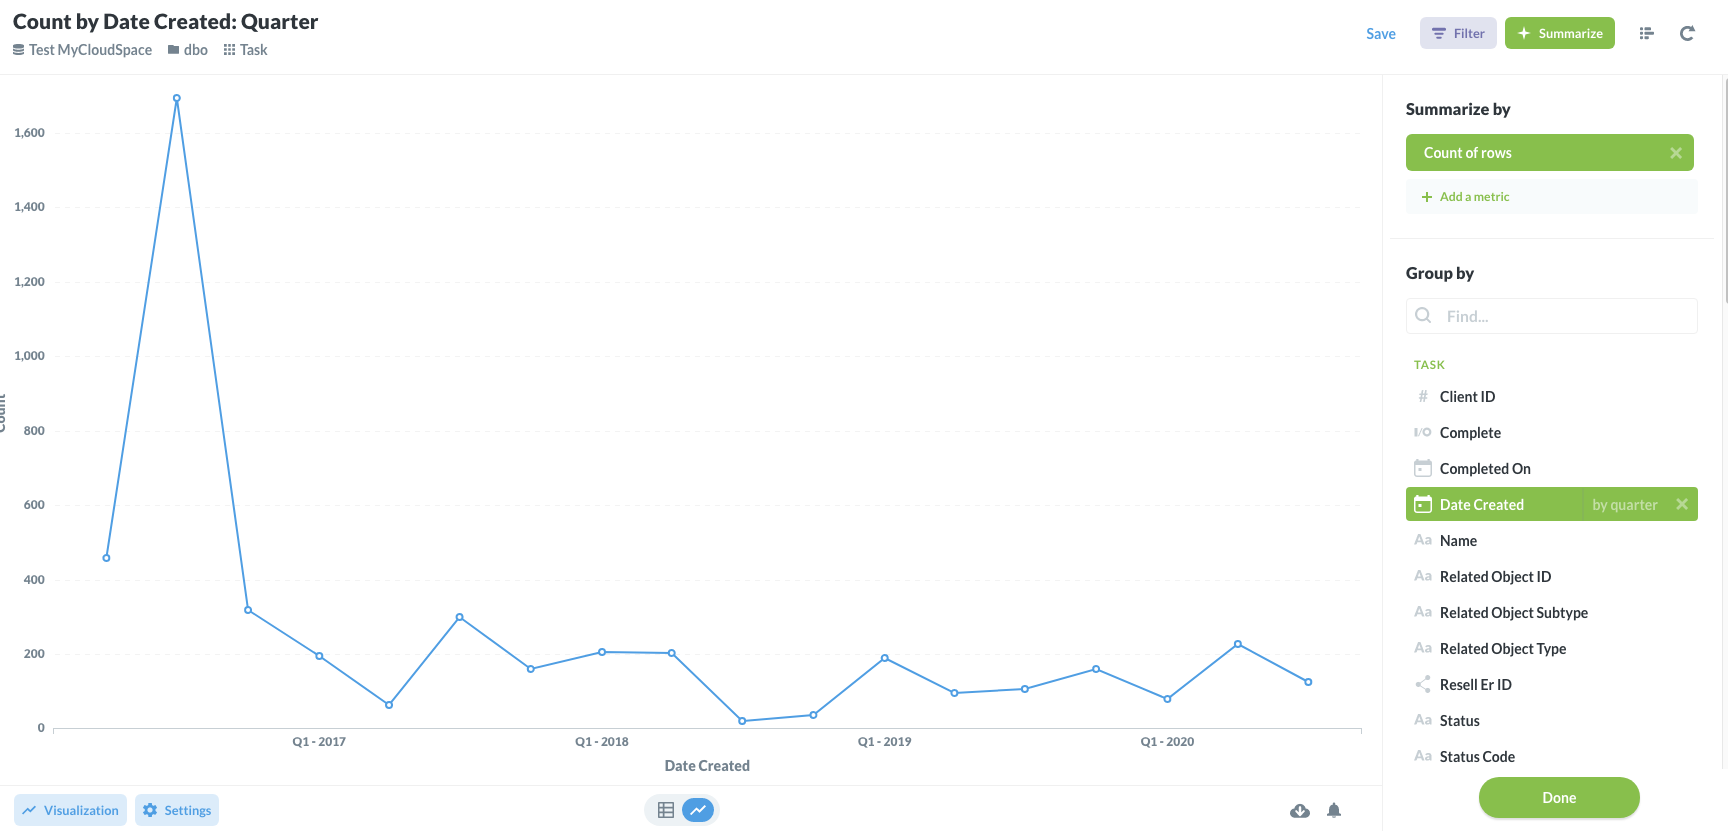
Let's use this same table, group all tasks by the date created and roll it up to a quarterly value. Do do this hit the summarise button again and then under group by I selected DateCreated and highlighted Quarter as the resolution. You will then see the following.
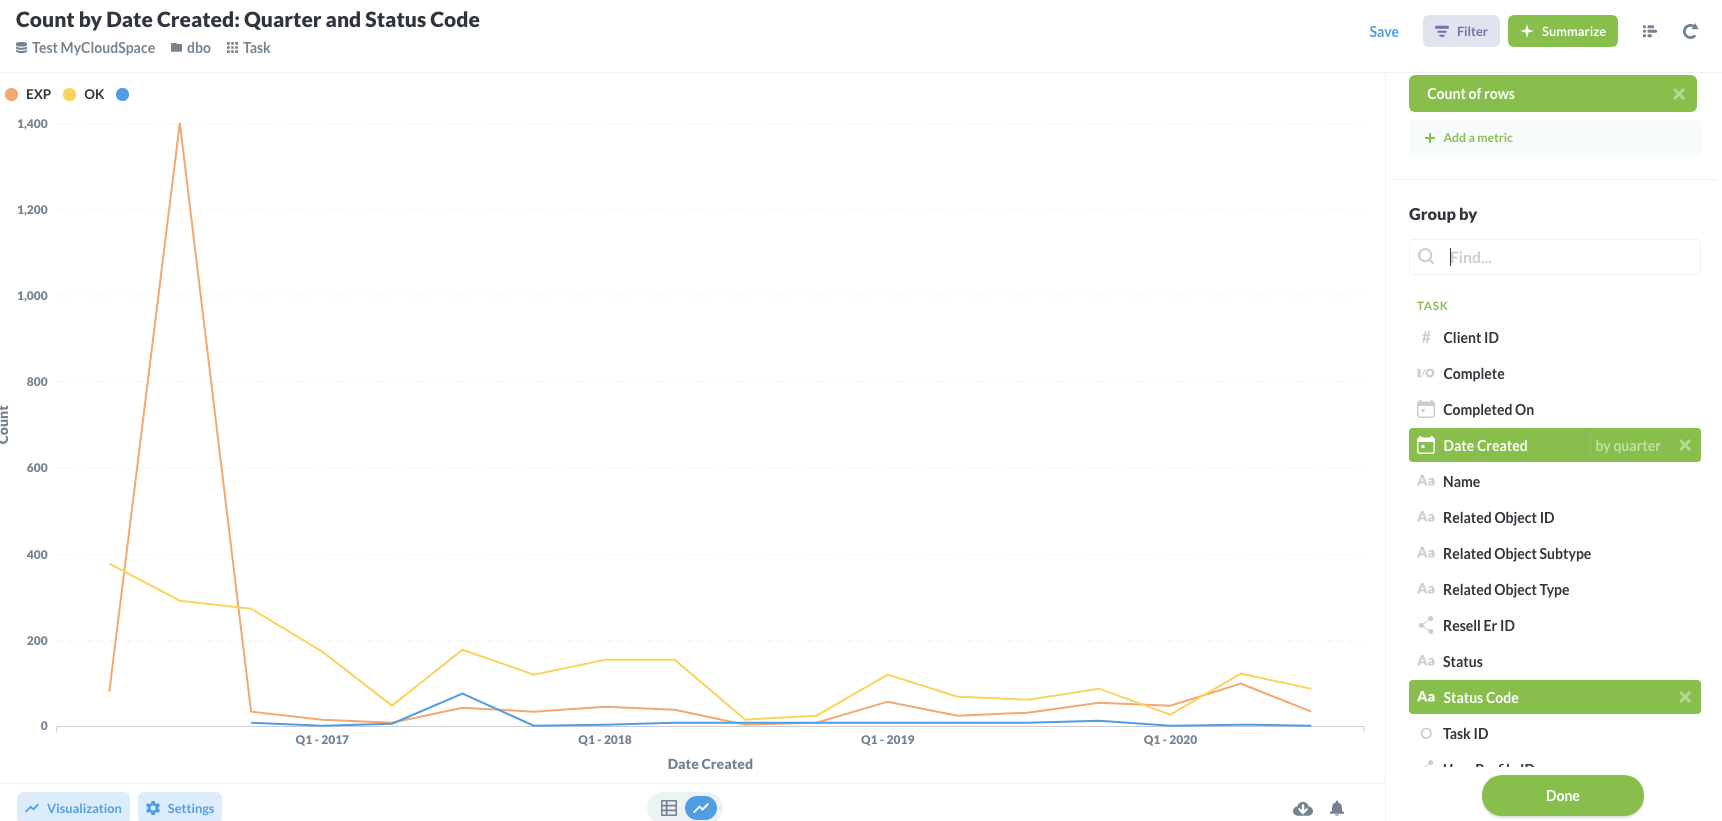
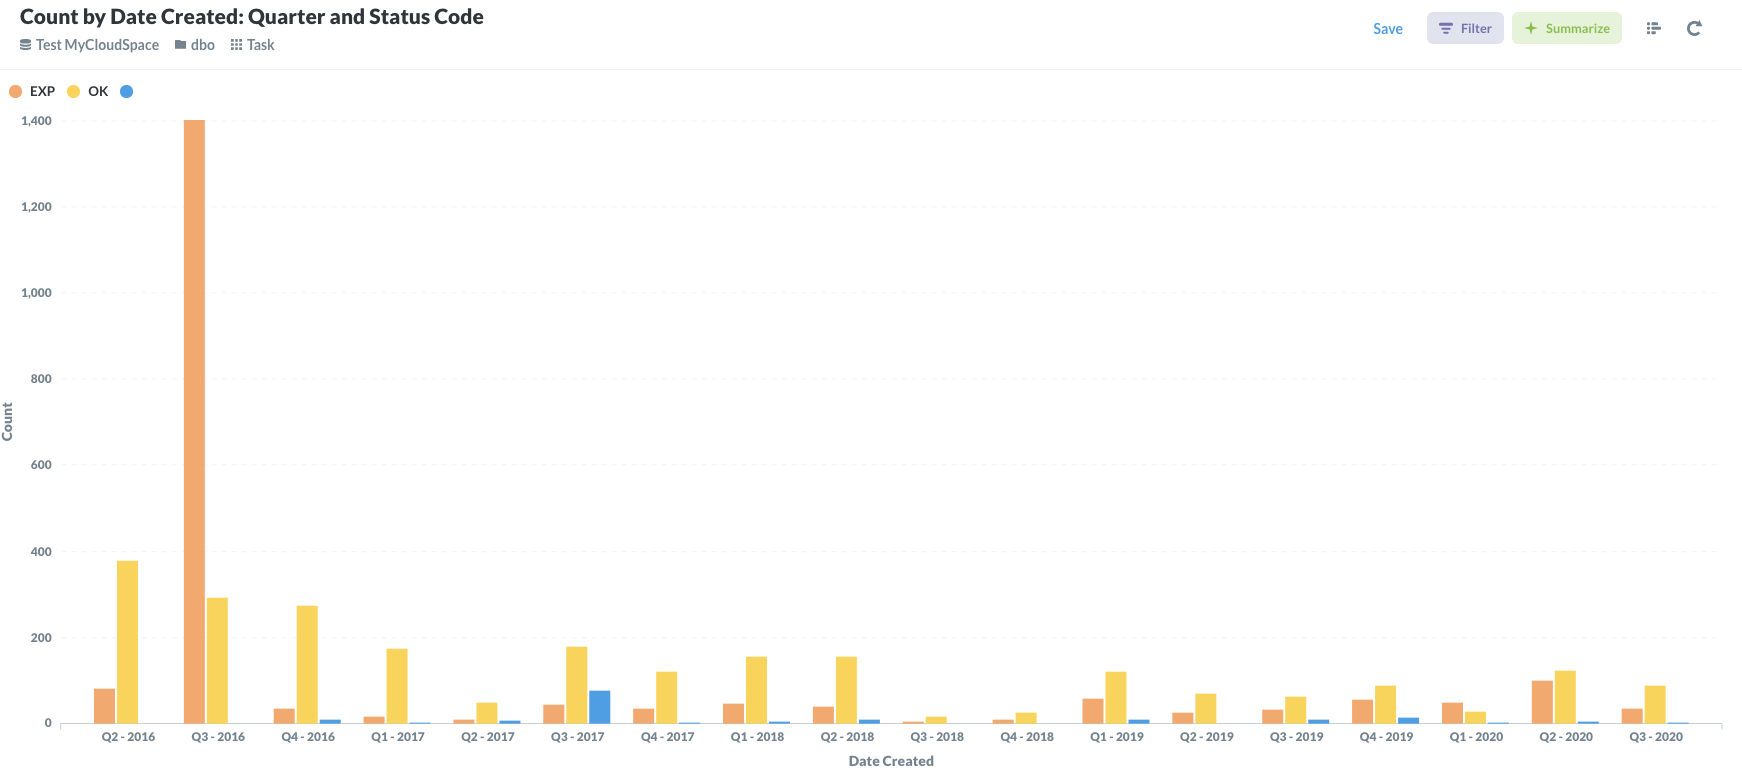
Again fairly useful but what I would like to do now is group this by the status code as well so i can see fail/success/running tasks but also retaining our quarterly grouping.
To do that I clicked summarise again and used the + sign on the status code, the graph then updates to the following.
As with any data presented you can change the visualisation options.
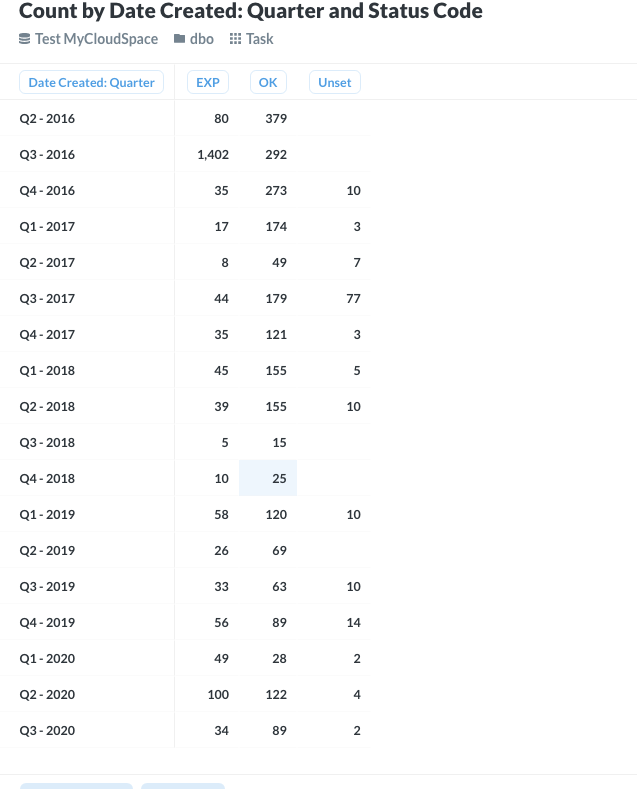
Here is the same data in a table form
And here it is again but as a bar graph
Ok so now you have a question you can save this to a dashboard so you can come in at any time. Do this but clicking Save and giving it a meaningful name.
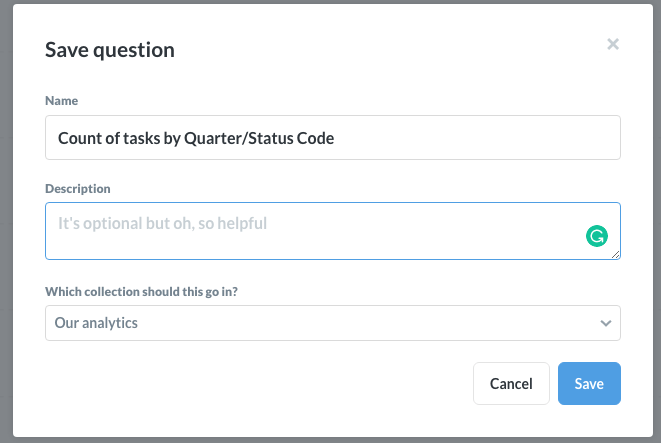
As part off this you will be asked if you want to add it to a dashboard, I opted to do so and created one called First Dashboard
Now you can customise the sizing and save the dashboard and come back so see the following.
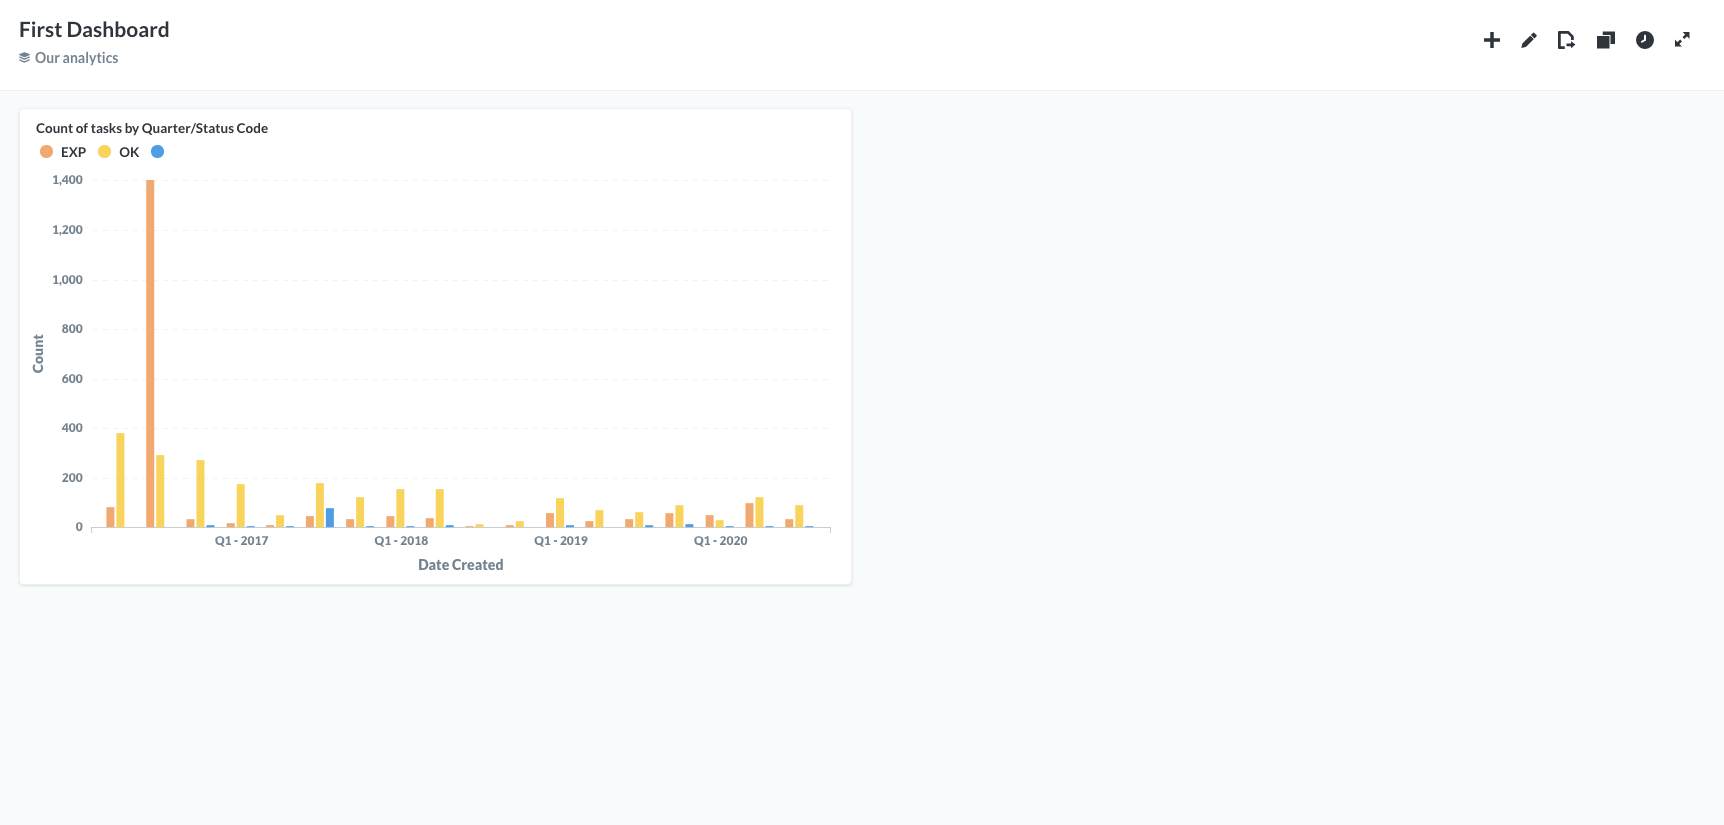
That's it! Go ask some more questions and add it to your dashboard.
In a followup post I will cover some of the other features like Custom queries so you can start joining other tables, pulses which are automated reports sent to you based on your queries etc.
Happy analysing!